Investment Performance
Fiscal Year 2021
The 1693 Partners Fund generated strong investment results in FY21, as investment returns of 36.8% produced record-setting gains of approximately $250 million for the Fund.
As you can see from the table below, these results compare favorably to the portfolio’s Policy Benchmark of 35.4%. Importantly, longer term investment performance is also strong and comfortably ahead of the benchmark. Assets in the Partners Fund at the end of the fiscal year were $942.7 million, an all-time high.
The strong performance in FY21 was driven in large part by the investments made in Private Equity, specifically venture capital. There were also strong absolute and relative gains made in global public equities during the fiscal year.
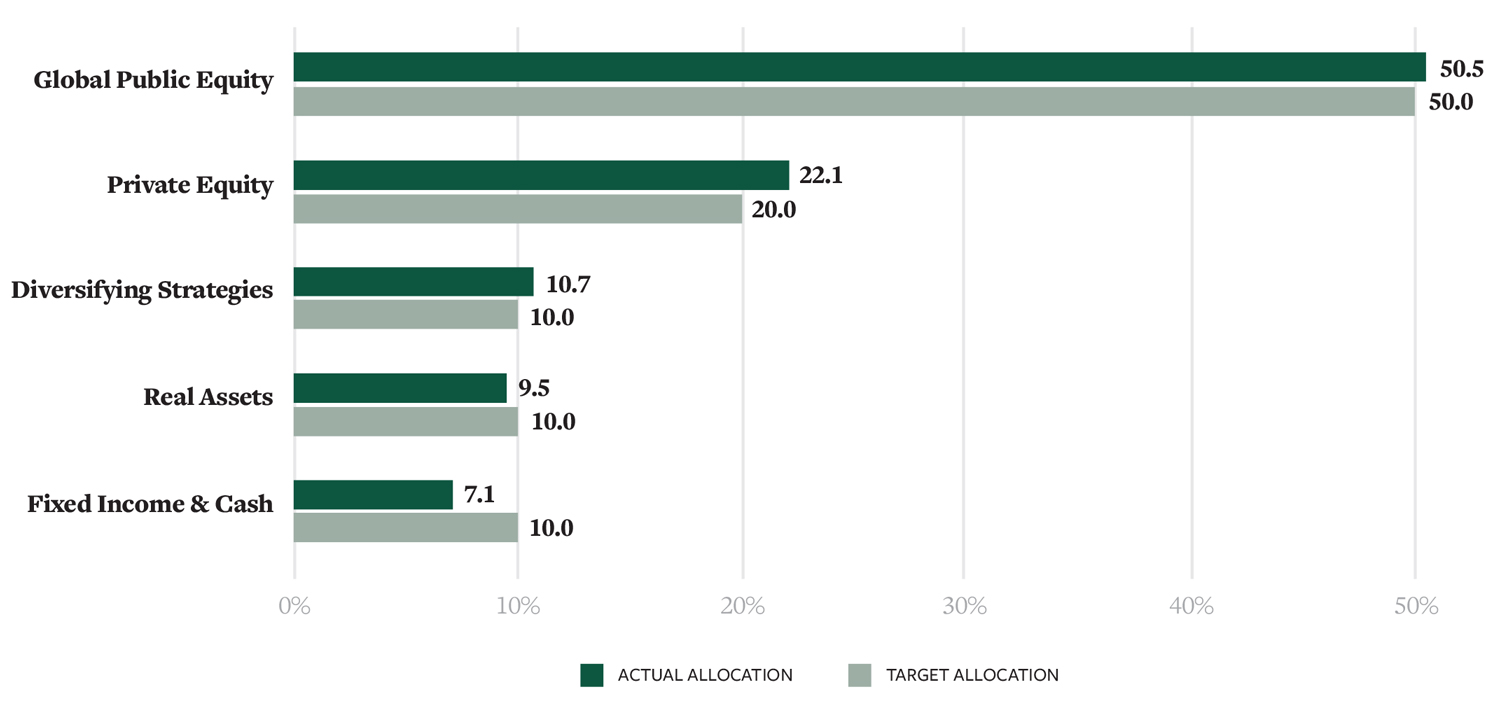
1693 Partners Fund Actual versus Target Allocations
As of June 30, 2021
The table below highlights the Partners Fund asset allocation as of the end of FY21. On balance, the
Partners Fund is hovering around the target allocations amongst the various broad asset classes.
In aggregate, the portfolio’s investments in Global Public Equities returned 43.0% for the fiscal year, besting the MSCI All-Country World, its relative benchmark, by 313 basis points. As of June 30, 2021, Global Public Equities represented 50.5% of the aggregate portfolio. In terms of geography, the best performing asset class, as it has been for the last several years, was the U.S. The portfolio’s U.S.-focused investments returned 52.0%, far exceeding the Russell 3000 index, which returned 44.2% for the same 12-month period. Central to this outperformance was the portfolio’s weightings in small capitalization stocks as well as value-oriented securities, both of which received a nice lift when it became clear that the vaccine announcements were going to be a positive in terms of resuming economic activity.
Developed International Equities, with a weighting of 18.8% of the portfolio, returned 35.1%, exceeding the MSCI EAFE benchmark return by 270 basis points. From a geographic perspective, the laggards in the global equity allocation were Emerging Market equities. The portfolio’s modest exposure to these markets, 5.5% of the overall portfolio, returned 32.5%, underperforming the MSCI Emerging Markets benchmark which returned 40.9%.
Private Equity, which includes venture capital, buyout, and growth equity, was the second largest allocation in the portfolio at 22.1% of assets. The portfolio saw a sizable increase in value as these investments in the aggregate appreciated by 66.7% for the fiscal year. Driven principally by our commitments to early-stage venture capital, the portfolio was able to capture much of the long-term investment trends centering around the increasing adoption of cloud computing, software-as-a-service, e-commerce and the consumer switch to digital (a trend accelerated by the pandemic), security and data privacy, artificial intelligence and machine technology as well as emerging areas such as space flight and exploration, autonomous and electronic automation and blockchain technology. Consumer health, healthcare technology and biotechnology are also strong trends within our venture capital portfolio.
The investment case for strategies that can potentially diversify the investment risks (and generate investment returns) within an investment portfolio beyond traditional equity or fixed-income risks is compelling given the heightened risks currently observable within those more traditional asset classes. The Partner Fund’s exposure to these types of investments — we categorize them as Diversifying Strategies — sums to 10.7% of the overall portfolio. This allocation includes investments in private credit, lending to private businesses who need investment capital to grow, acquire and invest; multi-strategy hedge funds; as well as several non-correlated strategies, including cash flow-based royalty investments. While all investments involve some level of risk to achieve an acceptable rate of return, these types of investments can provide the portfolio a differentiated return profile compared to the 70.0% combined exposure to equities (both public and private).
Fixed Income assets within the portfolio remain modest, representing 3.8% of the portfolio. Interest rates remain low and credit spreads are at historically low levels. As a result, it is hard to see investments within more traditional fixed income asset classes achieving the same historical investments results and likewise achieve returns sufficient to reach the hurdle rate for the portfolio. That said, fixed income does play a role in the liquidity management of the portfolio and thus, while the prospective returns will be muted, it is valuable to maintain some cash for strategic reasons.
Finally, Real Assets, with a 9.5% weighting in the portfolio, has a heavy allocation to real estate. In FY21, the real asset portfolio returned 21.6% while the benchmark returned 42.3%. While the allocation underperformed over the one-year measurement period, relative long-term investment performance has been quite positive relative to the benchmark. Important real estate sub-sectors for the Fund include self-storage, multi-family apartments, office and industrial warehousing.
Brian Hiestand
1693 Partners Fund Chief Investment Officer
Not reflected in the FY21 financial report are all endowed monies held by university-related foundations. Smaller accounts are not included in the report
1693 Partners Fund
As of June 30, 2021The William & Mary Foundation, Marshall-Wythe School of Law Foundation, William & Mary Business School Foundation and Murray 1693 Scholars Foundation are all members of the 1693 Partners Fund.
| 1 year | 3 year | 5 year | 10 year | 15 year | |
|---|---|---|---|---|---|
| 1693 Partner Fund1 | 36.8% | 13.0% | 12.1% | 8.6% | 7.5% |
| Target Benchmark2 | 35.4% | 11.9% | 11.3% | 7.5% | 6.4% |
1. Fund-level investment performance is presented net of investment manager fees and gross of internal operating expenses.
2. 56% MSCI All Country World Index, 24% Bloomberg Barclays Aggregate Index, 2% Bloomberg Barclays U.S. Credit Index, 8% Bloomberg Barclays U.S. High Yield Index, 10% Bloomberg Commodity Index; Beginning January 1, 2017: 50% MSCI All Country World Index, 15% Russell 2000 Index, 10% Bloomberg Barclays Aggregate Index, 15% HFR Fund of Funds Index, 5% MSCI U.S. REIT Index, 5% S&P North American Natural Resources Index.
Board of Visitors
As of June 30, 2021
| 1 year | 3 year | 5 year | 10 year | 15 year | |
|---|---|---|---|---|---|
| Total BoV Account | 25.2% | 9.5% | 9.5% | 7.2% | - |
| Target Benchmark | 23.0% | 9.6% | 9.3% | 8.0% | - |
Virginia Institute of Marine Science Foundation
As of June 30, 2021
| 1 year | 3 year | 5 year | 10 year | 15 year | |
|---|---|---|---|---|---|
| Total VIMS Foundation Account3 | 8.1% | 4.5% | 7.0% | 6.1% | - |
| Target Benchmark4 | 7.6% | 3.6% | 6.3% | 5.1% | - |
3. WAMIT investments as of September 30, 2020; LCG Associates investments beginning April 2021; Investment performance is net of all fees and expenses.
4. April 2021 to present: 52.5% MSCI ACWI, 10% MSCI ACWI Small Cap, 7.5% MSCI Emerging Markets, 25% BloomBarc US Aggregate, 5% T-Bills; October 2020 to April 2021: 100% T-Bills; Prior to October 2020: 56% MSCI All Country World Index, 24% Bloomberg Barclays Aggregate Index, 2% Bloomberg Barclays U.S. Credit Index, 8% Bloomberg Barclays U.S. High Yield Index, 10% Bloomberg Commodity Index; Beginning January 1, 2017: 50% MSCI All Country World Index, 15% Russell 2000 Index, 10% Bloomberg Barclays Aggregate Index, 15% HFR Fund of Funds Index, 5% MSCI U.S. REIT Index, 5% S&P North American Natural Resources Index
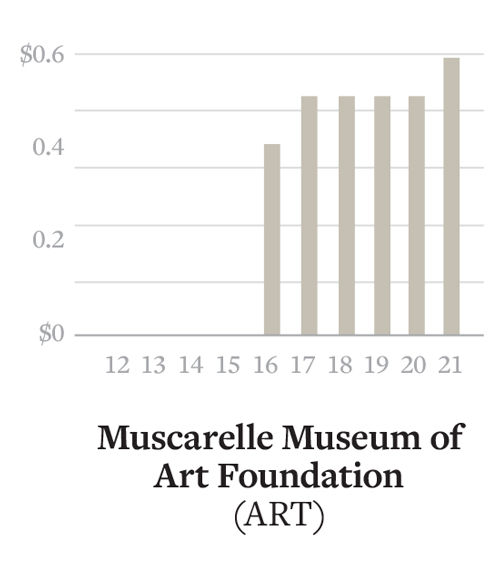
Muscarelle Museum of Art Foundation
As of June 30, 2021
| 1 year | 3 year | 5 year | 10 year | 15 year | |
|---|---|---|---|---|---|
| Total ART Account | 26.9% | 11.1% | 10.2% | - | - |
| Target Benchmark | - | - | - | - | - |
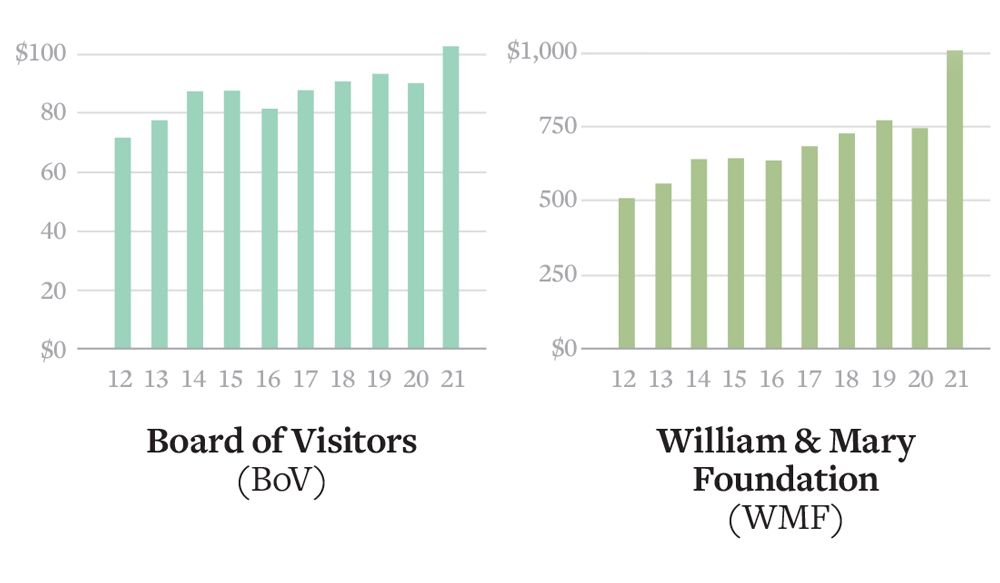
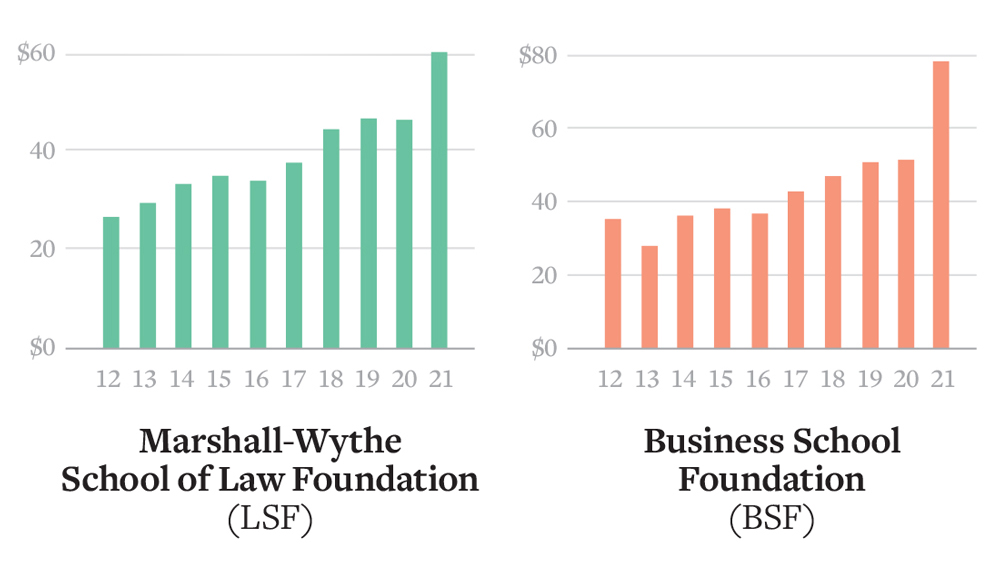
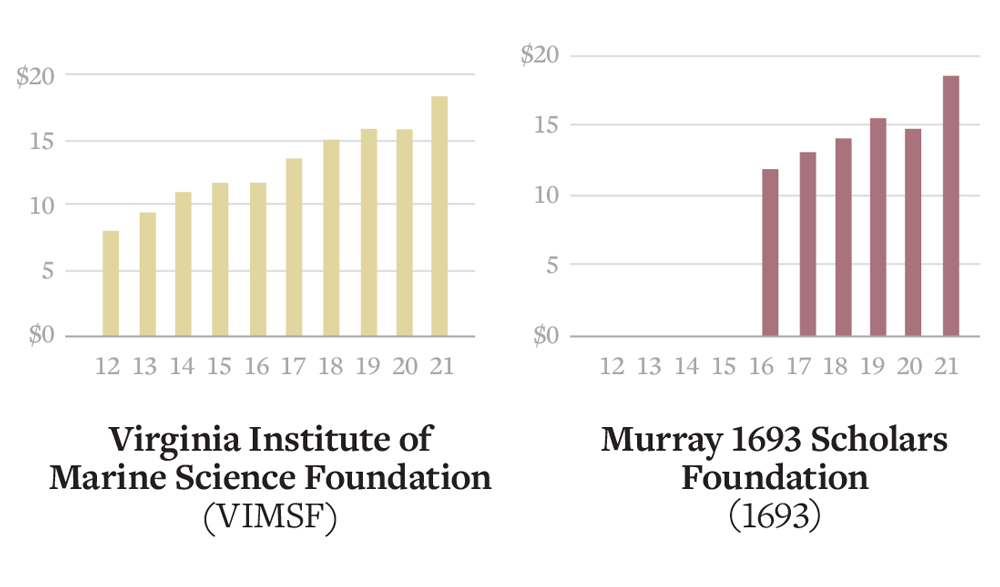
10-Year Growth in Consolidated Endowment
Scales are different for each pool of capital. Each endowment is represented in the chart below by color.
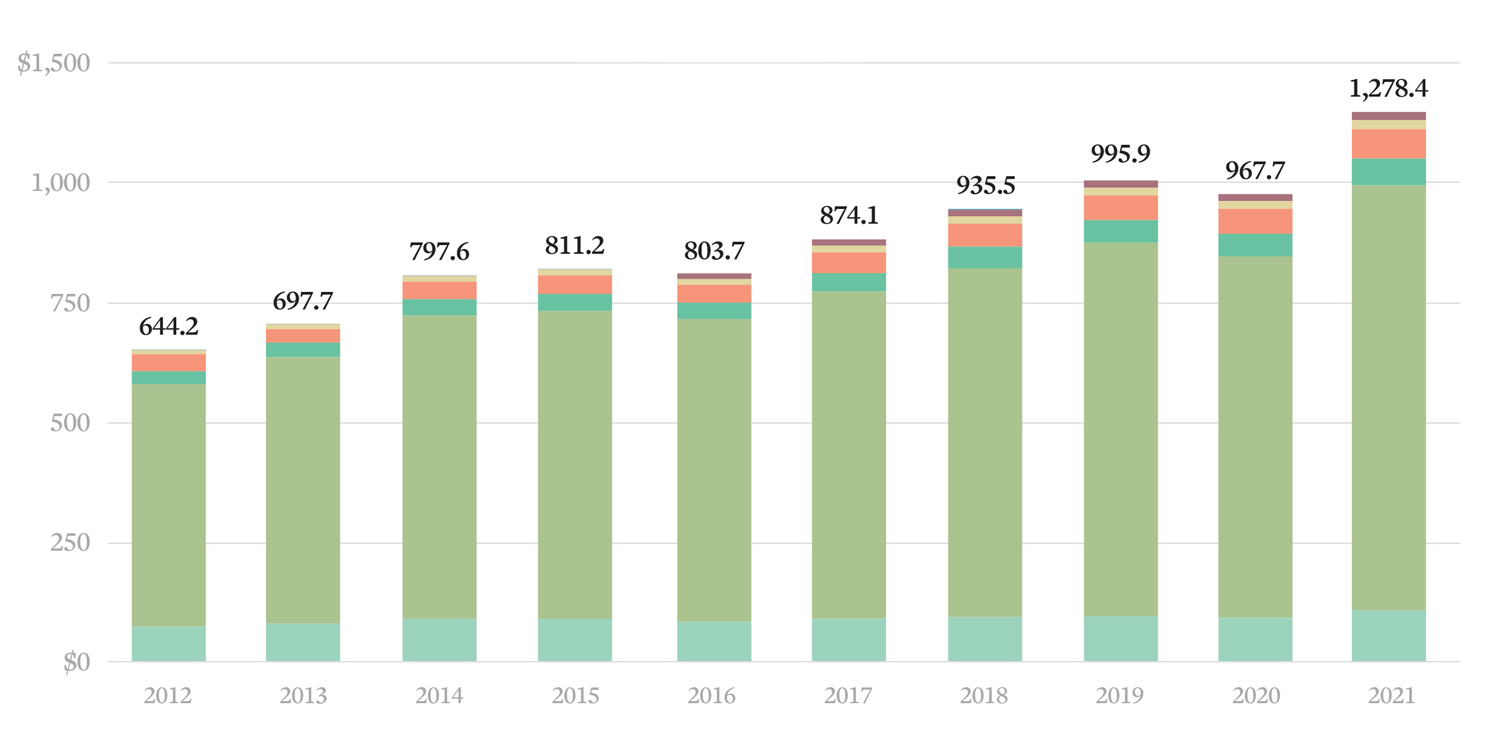
10-Year Combined Growth for all W&M Endowments
All dollar figures shown in millions.


