Financial Overview
From Chief Operating Officer Amy Sebring M.P.P. ’95
William & Mary’s financial position in fiscal year 2020 (FY20) started strong. In the first six months, we benefited from the stock market reaching near historic highs and a new 20-year commitment of resources by the Commonwealth of Virginia to create a “tech talent pipeline” meant to benefit higher education generally and William & Mary specifically.

The university also embarked on a strategic planning initiative in early FY20 with an overarching goal of addressing William & Mary’s most pressing challenges and seizing its most promising opportunities. During the first phase of that effort the university updated and adopted its mission, vision and values statements. The second phase involved an intensive environmental scan of William & Mary’s current position and potential opportunities.
As we moved into the winter, William & Mary began facing unprecedented challenges as the community, commonwealth, nation and world confronted a global coronavirus (COVID-19) pandemic.
By spring 2020, it became clear that the university’s focus needed to shift to operating amid a pandemic. As a result, President Rowe put a temporary pause on strategic planning for the remainder of the academic year, turning the university’s attention to closing the books for FY20, successfully concluding the For the Bold campaign and preparing for a new academic year unlike any we had previously experienced.
FY20 OverviewDespite the strong start to the fiscal year, the university faced considerable challenges in the fourth quarter of FY20 as anticipated revenues from study abroad programs, spring athletics, housing and dining fell short and costs escalated as we converted over 2,000 courses to remote instruction and moved much of the university’s workforce off campus. The university responded by instituting a hiring freeze for all positions not deemed to be mission critical, taking aggressive cost containment actions and requiring all departments to undergo a rigorous base budget exercise to evaluate options for reallocating or reducing funding to protect the core mission in the face of potential revenue disruptions. With those combined efforts, the university finished FY20 with a positive margin of $7.6 million, excluding depreciation and non-operating expenses. As of June 30, 2020, the market value of W&M’s total endowment was $995 million, including $27.3 million in revocable endowments held by third parties. The portfolio remained strong, with only a slight decrease over the prior year. The Board of Visitors’ endowment and the William & Mary Investment Trust (WAMIT) together remain the largest of the investment portfolios, and both remain highly diversified across asset classes. As President Rowe mentioned, the university completed its boldest fundraising campaign yet, with $1.04 billion raised. Through the campaign, William & Mary strengthened its bonds with alumni and cemented its status as the No. 1 public university for alumni participation. Even in the midst of a pandemic and uncertainty in the world, the university raised more than $149.9 million in FY20 — the single largest fundraising year ever for the university. In addition, investments in academic facilities and infrastructure remain strong. With significant support from the commonwealth for construction and renovation of academic facilities, work has begun again on the construction of state-of-the-art educational and performance facilities for its music, theater, dance and speech programs. The new Fine & Performing Arts Center is expected to open in fall 2022 and will include almost 135,000 gross square feet of new teaching and performance space, as well as renovation of over 35,000 gross square feet in Phi Beta Kappa Hall. On the Gloucester Point campus, construction continues on a new research facility and an oyster hatchery for William & Mary’s Virginia Institute of Marine Science (VIMS) and the construction of new research facilities for VIMS on the Eastern Shore. The university is benefiting from the generosity of donors with the completion of the Tribe Field Hockey Center, the opening of the Alumni House in late summer 2020 and the Memorial to the Enslaved, as well as new efforts to complete the design of The Martha Wren Briggs Center for the Visual Arts. The center will encompass the renovation and expansion of the Muscarelle Museum of Art, and is slated to open in 2023. |
||||||||||||||||||||||||||||||||||||||||||||||||||||||||||||||||||||||||||||||||||||||||||||||||||||||||||||||||||||||||
InvestmentsThe university’s consolidated endowment, including revocable funds, fell just shy of the $1 billion reported in FY19. As of June 30, 2020, the university’s consolidated endowment, excluding the revocable endowments, concluded the fiscal year with a market value of $967.7 million, reflecting a net decrease of $28.2 million, or 2.8%, from last year. Those funds — coupled with a revocable endowment valued at $27.3 held by a third party — brings the total value of endowments held by all of the various entities supporting William & Mary and its programs to $995 million. WAMIT, the largest depository for the university’s invested endowment, completed the fiscal year with an investment return of -0.47% with assets under management of approximately $716.6 million. Comparatively, WAMIT’s blended Policy Benchmark, which comprises several weighted indexes reflective of WAMIT’s major investment categories, returned -0.31%. Returns for the major asset class groupings over the last one-, three-, five- and 10-year periods are below. William & Mary Investment Trust (WAMIT) Performance ReportAs of June 30, 2020
(1) Investment performance is net of all fees and expenses (2) Policy Benchmark: 56% MSCI All Country World Index, 24% Bloomberg Barclays Aggregate Index, 2% Bloomberg Barclays U.S. Credit Index, 8% Bloomberg Barclays U.S. High Yield Index, 10% Bloomberg Commodity Index, Beginning January 1, 2017: 50% MSCI All Country World Index, 15% Russell 2000 Index, 10% Bloomberg Barclays Aggregate Index, 15% HFR Fund of Funds Index, 5% MSCI U.S. REIT Index, 5% S&P North American Natural Resources Index Impact of COVID-19 on the EconomyFY20 was punctuated by one of the largest economic contractions in modern history, brought on by the global pandemic. COVID-19 introduced a large degree of uncertainty into our daily lives as well as in the financial markets — although if one were to look at the financial markets at the start of the fiscal year and then at the end of the fiscal year, one would think that it had been relatively benign. Equity markets, at least in the U.S., were generally positive for the fiscal year, while the safety of U.S. government bonds were viewed as attractive despite their relatively modest yield. That benign outcome, however, doesn't tell the complete story as there was tremendous volatility starting in February, when it became clear that the virus was going to have a significant impact on economic activity as global political leaders began taking measures to stop the spread of the virus. That realization began a cascade of events that led to the financial markets dropping approximately 30% in a handful of weeks and the global central banks unleashing an unprecedented amount of monetary stimulus. Fiscal measures by governments around the world provided much-needed financial assistance to displaced workers. As a result of these policy maneuvers, confidence reentered the financial markets, which provided a rebound just as ferocious as the drawdown, although the economic reality was not as sanguine. WAMIT held steady during this time period, aided by a portfolio diversified by geography, investment strategy and investment managers. WAMIT Asset AllocationThis represents the collective investments of the W&M Foundation, Business School Foundation, Law School Foundation, VIMS Foundation and the Murray 1693 Scholars Foundation as of June 30, 2020.
*The 100 percent figure is derived from total equities, diversifying strategies, distributed securities cash, real assets and fixed income. |
||||||||||||||||||||||||||||||||||||||||||||||||||||||||||||||||||||||||||||||||||||||||||||||||||||||||||||||||||||||||
Future OutlookHeading into FY21, the university was projecting financial losses between $30 million and $100 million. The wide variation in those projections reflected the uncertainty of the virus as the surrounding region saw a significant uptick in COVID-19 positivity rates in July, following substantial declines earlier in the summer, as well as uncertainty about student response coming into the fall semester. The university worked diligently over the course of the summer to provide in-person and remote options for students. The university successfully reopened for the fall semester, welcoming approximately 70% of our students back to Williamsburg while continuing to serve many remotely both in the U.S. and abroad. Overall, enrollments have remained stable, with little movement in our undergraduate population. Graduate enrollments continue to grow in business, education and law. For students who are living on campus or residing locally, the university has taken an aggressive approach to COVID-19 testing, seeking to identify asymptomatic positives among the student population to limit spread. In addition, the university has adopted Healthy Together, a universitywide commitment to behavioral norms and expectations, given the current public health crisis. The decisions we have made to reduce the risk of spread of COVID-19, while at the same time maintaining the health and well-being of our community, have impacted the university’s financial position for FY21. However, they have also allowed us to operate in a manner that is keeping us closer to the lower end of the projected losses rather than the upper end we initially feared if we had been unable to provide an on-campus experience for our students and were required to move fully to remote learning this academic year. As of the end of the first quarter of FY21, the university is projecting revenue shortfalls of around $25 million, including contributions from affiliated foundations, and COVID-related costs for the year exceeding $10 million. Costs associated with this include an aggressive COVID-19 testing program, personal protective equipment, space for quarantine and isolation, investments in technology and reallocation of staff to develop enhanced educational and co-curricular activities that are accessible to students both on campus and afar. Recognizing the financial realities we face, the university has continued its cost containment efforts and will use all available tools to help weather the storm. We are also utilizing this opportunity to look anew at how we have historically allocated resources to programs and to rebuild our budget in a manner that doesn’t simply perpetuate historical budget allocations, but ensures that resources are aligned with the university’s highest priorities and objectives. The university continues to navigate through these unprecedented times. Given the financial uncertainty, philanthropic support, particularly to the Fund for William & Mary, provides the university with unrestricted dollars that can help close gaps and address new needs in real time as we continue to operate under pandemic conditions. Importantly, while we remain steadfastly focused on the immediate needs of our students, faculty and staff, we continue to keep a long-term strategic focus. In October, the university sold bonds for the first time under its own AA credit rating (the university has previously issued debt through the Commonwealth of Virginia’s debt programs). The actions we took in October were two-pronged. We were able to refund much of our existing debt, taking advantage of favorable market rates, to provide some immediate financial relief for the university given the current conditions. We were also able to issue general revenue pledge bonds that will provide us with short-term cash flow should our financial position worsen as a result of the pandemic. But more importantly, this will provide us with working capital that will allow us to make strategic investments that will benefit William & Mary for the next decade as we complete the university’s strategic plan. |
||||||||||||||||||||||||||||||||||||||||||||||||||||||||||||||||||||||||||||||||||||||||||||||||||||||||||||||||||||||||
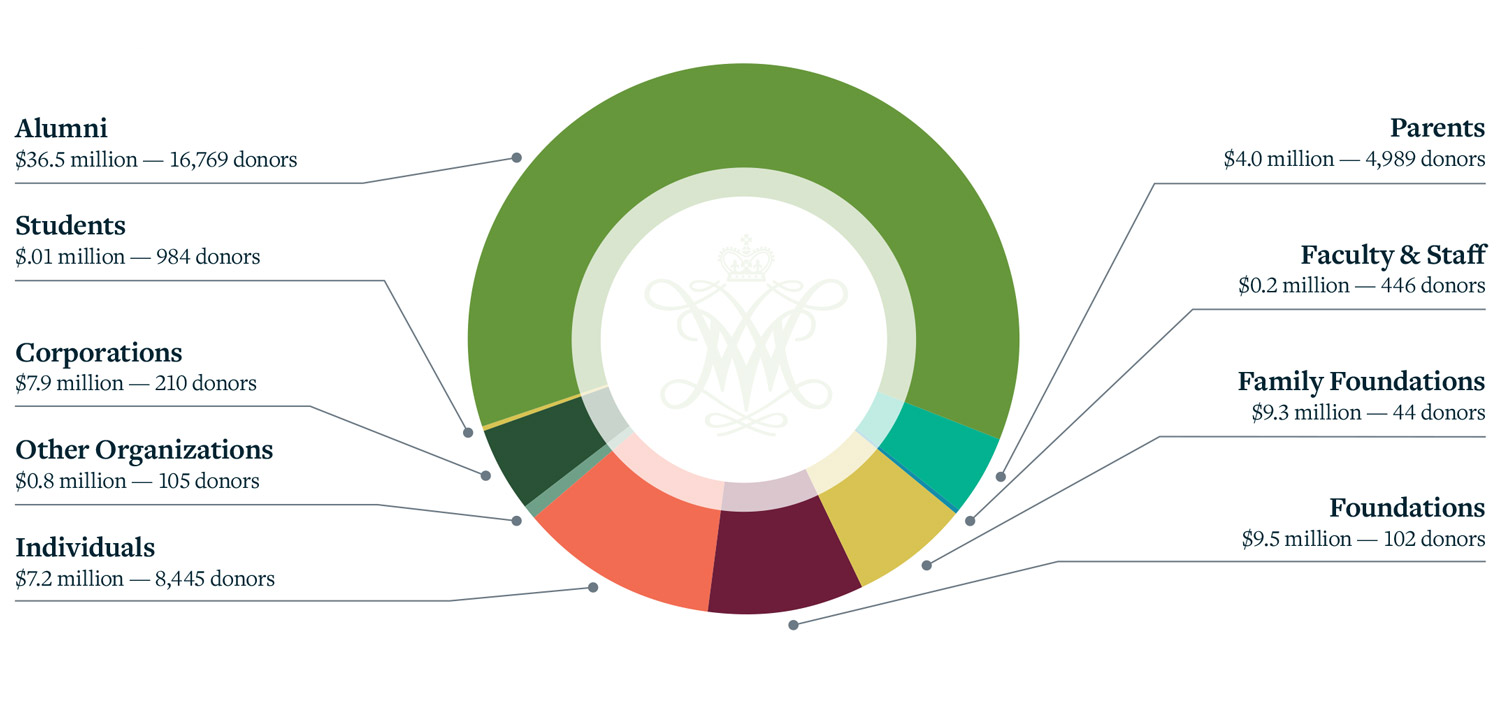
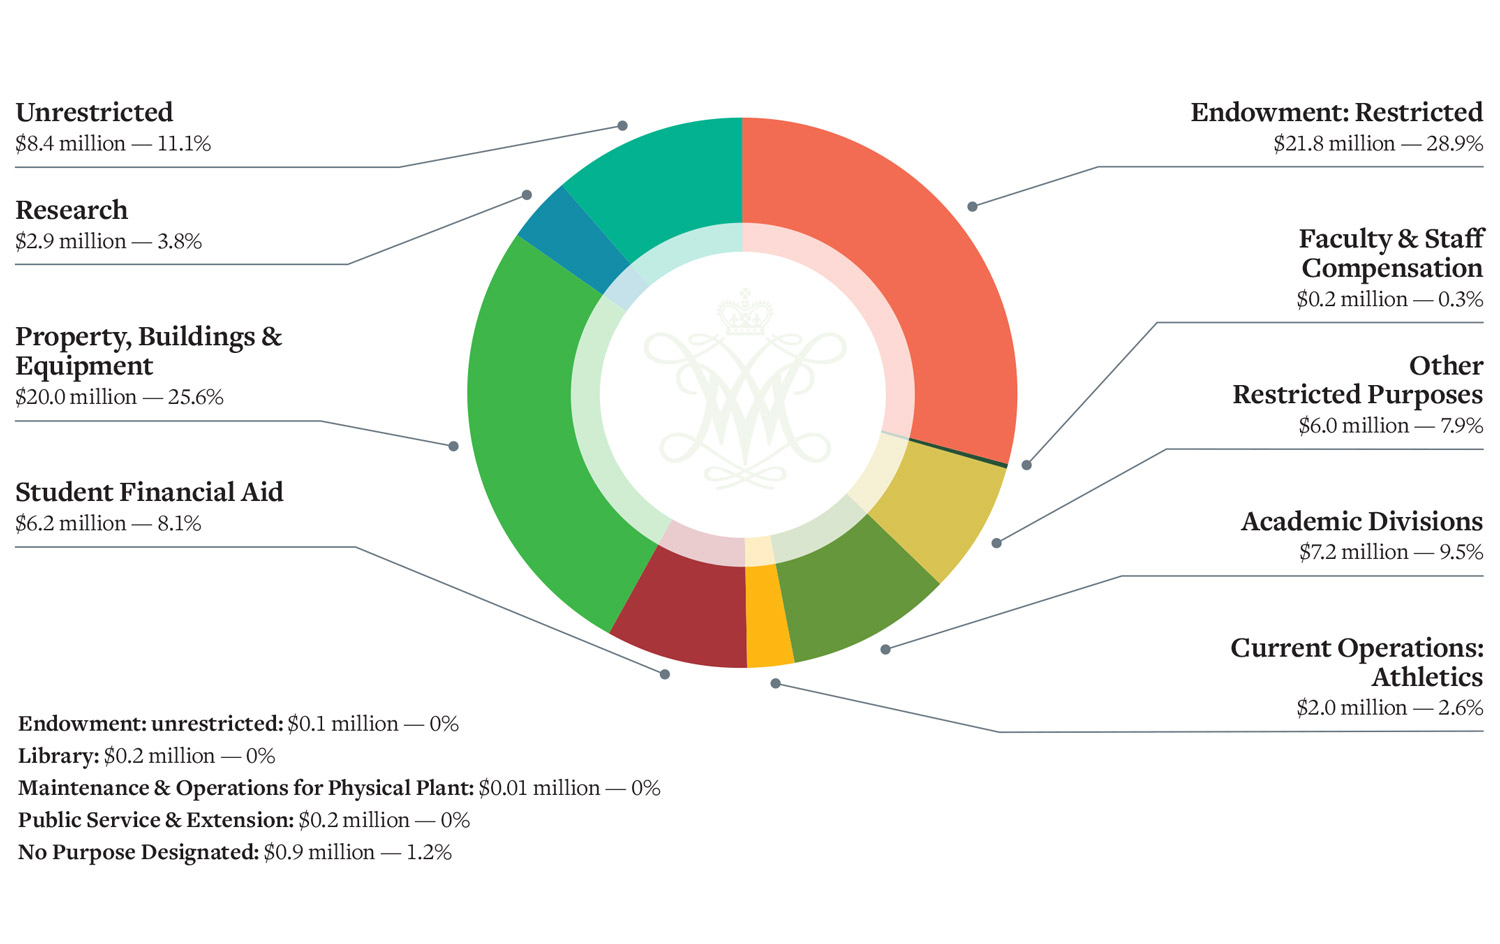
Private GiftsIn FY20, William & Mary raised more than $149.9 million. Pledges and commitments, including bequests and deferred gifts, are not indicated in the numbers below. This was the university’s largest fundraising year ever. Gifts by SourceGifts by PurposeGifts by AreaThe following charts show the allocation of gifts made to all areas of William & Mary and its related foundations between July 1, 2019, and June 30, 2020.
|
||||||||||||||||||||||||||||||||||||||||||||||||||||||||||||||||||||||||||||||||||||||||||||||||||||||||||||||||||||||||
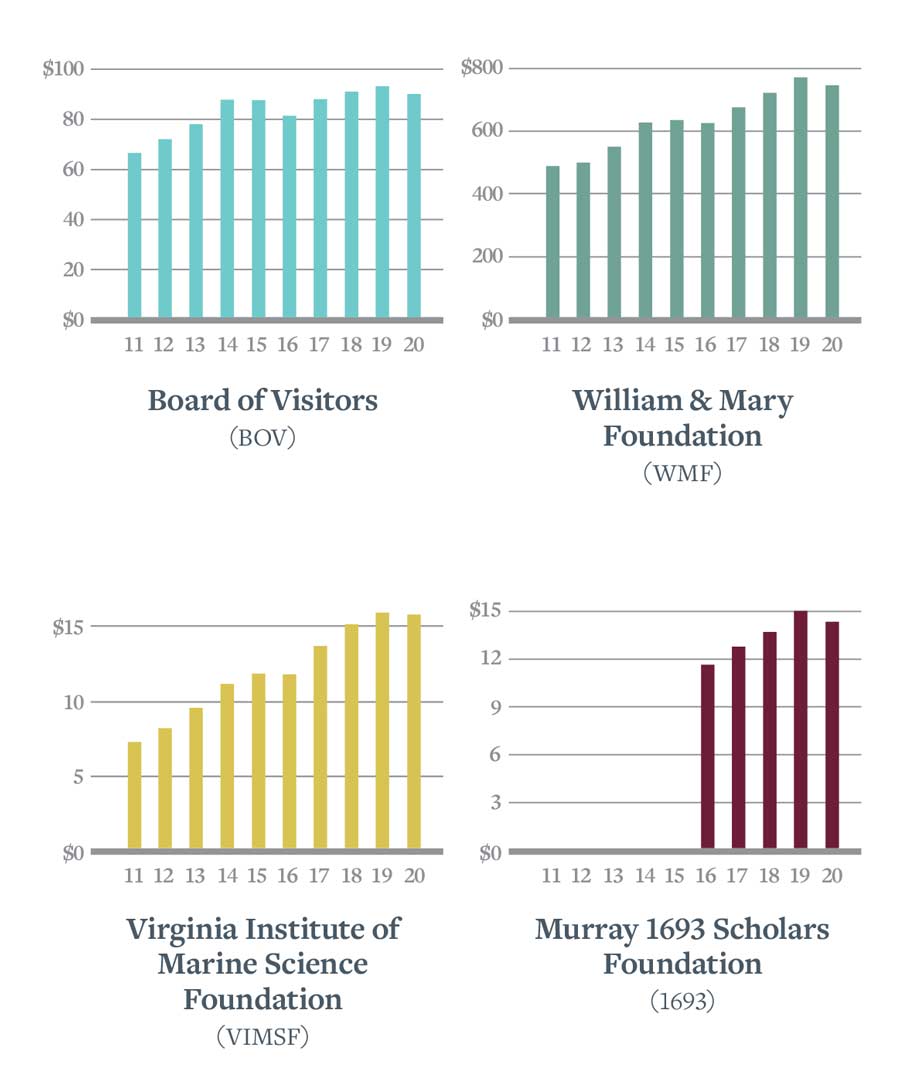
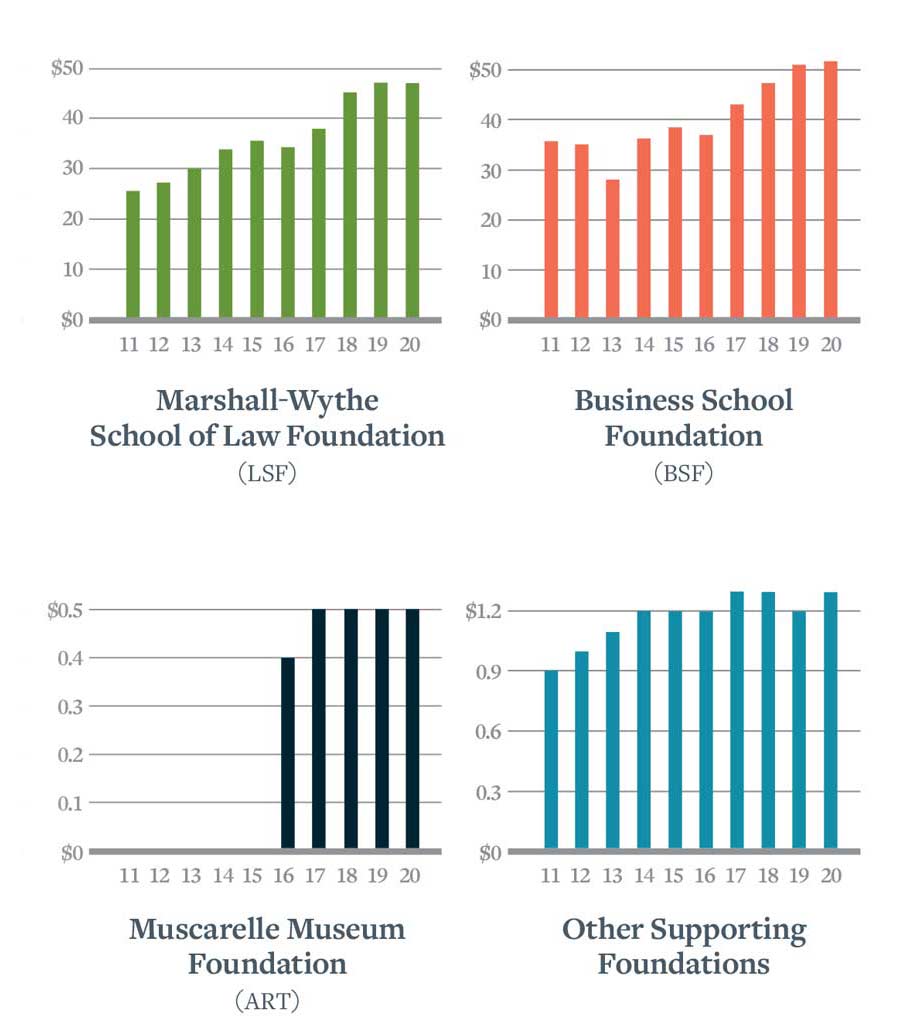
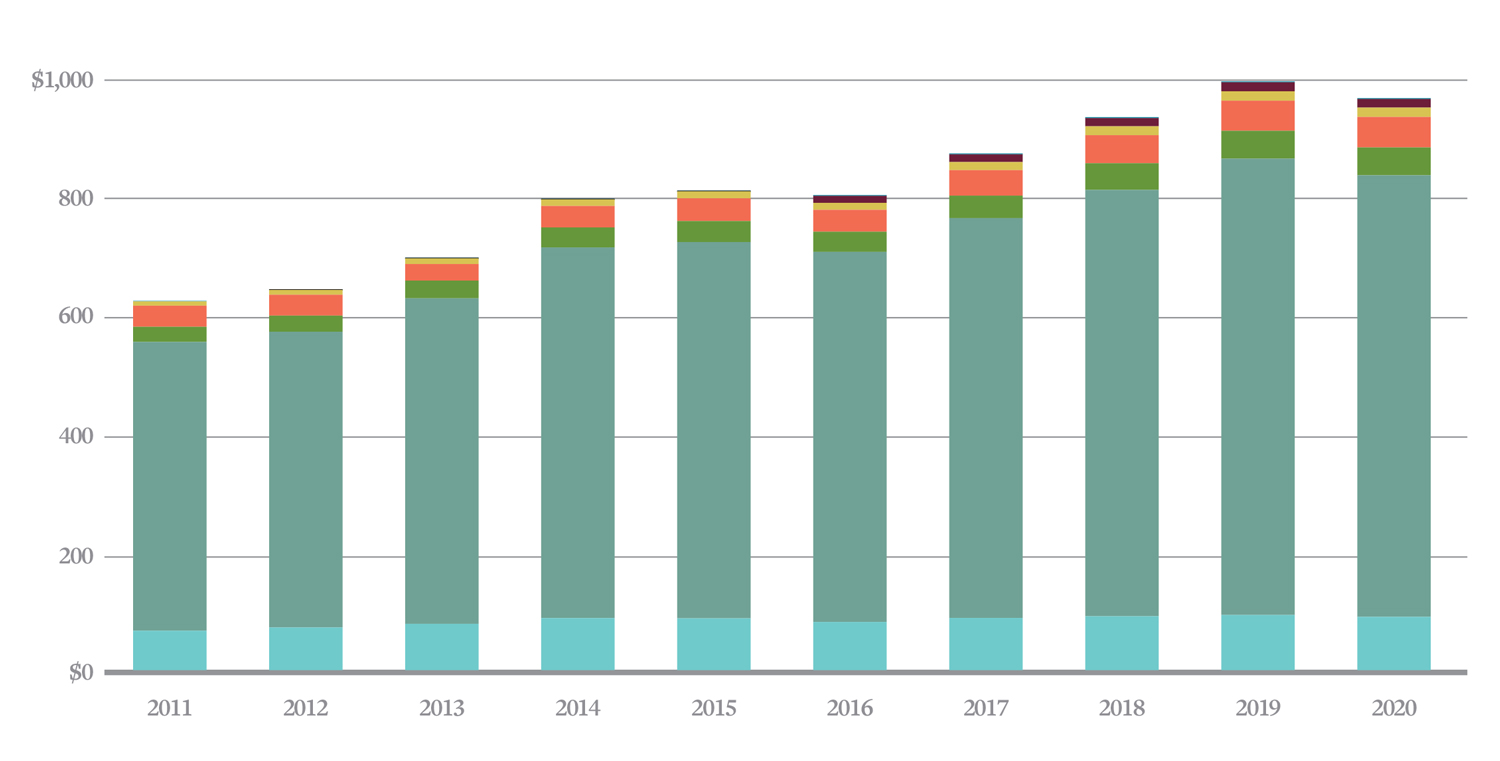
Endowment Growth10-Year Growth in Consolidated EndowmentEach endowment is represented in the chart below by color. 10-Year Combined GrowthAll dollar figures shown in millions. |
||||||||||||||||||||||||||||||||||||||||||||||||||||||||||||||||||||||||||||||||||||||||||||||||||||||||||||||||||||||||
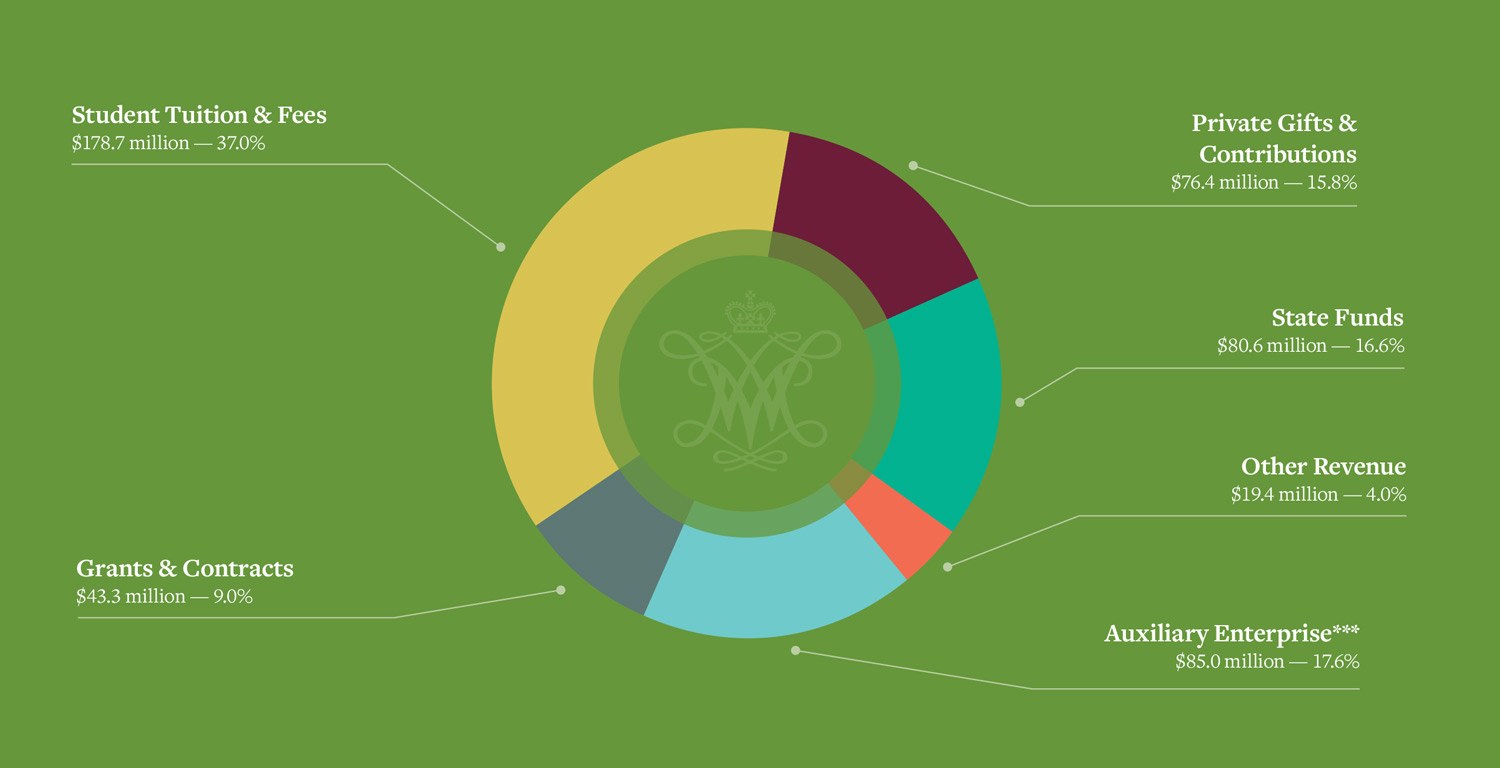
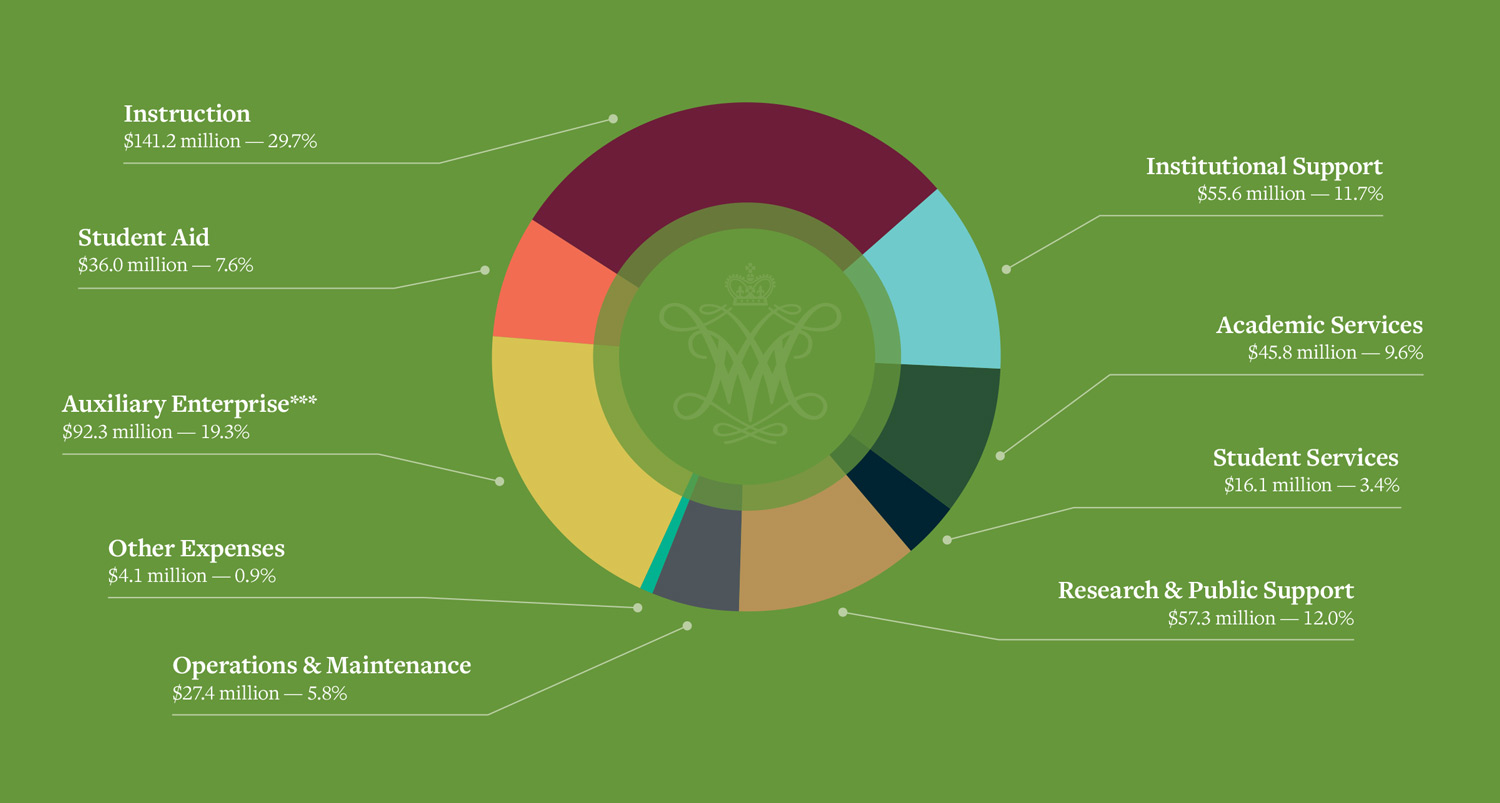
Operating Revenue & ExpensesWilliam & Mary Operating Revenue* — 483.4 million (unaudited)William & Mary Operating Expenses** — $475.8 million (unaudited)*Revenues include non-operating revenues that support operating expenses. How is W&M's operating revenue spent?Operating expenses, shown below, are divided among the following categories: Instruction: Instructional faculty, departmental operating costs |
||||||||||||||||||||||||||||||||||||||||||||||||||||||||||||||||||||||||||||||||||||||||||||||||||||||||||||||||||||||||


