Financial Overview
W&M Endowment Highest Ever at More Than $1 billion
Fiscal year 2019 (FY19) generated continued excitement with the arrival of Katherine A. Rowe as William & Mary's 28th president. In her first year, President Rowe engaged the campus in a period of discussion and reflection prior to moving into a focused strategic planning effort. This time of reflection, however, did not slow the university’s momentum. The 100th anniversary of coeducation, following on the previous year’s recognition of the 50th anniversary of African American students in residence, confirmed how far William & Mary has come, and yet how far it must go, to be a stronger and more inclusive community.
As the university began to see the daily impact of the For The Bold campaign, the university continued its march toward the $1 billion fundraising goal, recognizing the long-term impact that gifts of all sizes have in strengthening the university, providing critical endowment and discretionary funds that support the university’s highest priorities.
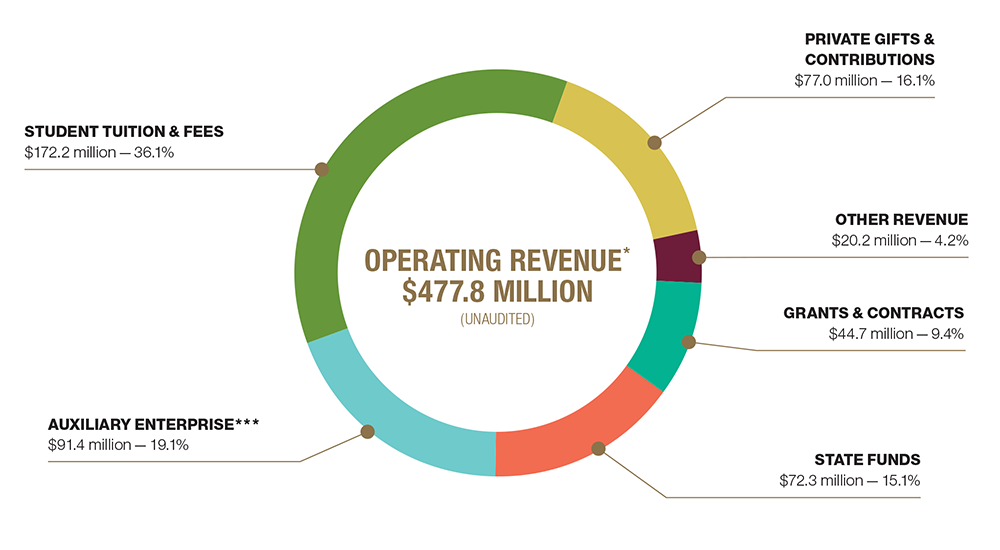
FY 2019 OverviewThe university remains in a solid financial position. William & Mary’s economic health continues to reflect its ability to recruit exceptional students, to raise revenue through tuition, fees, grants, contracts and philanthropy, to recognize and respond to the needs of the Commonwealth of Virginia and its citizens, and to reallocate funds to support the university’s highest priorities. William & Mary continues to attract, admit and retain top-caliber students even as we compete against the most selective public and private institutions in the country. Freshman applications to the university continue to be strong, with 14,681 students seeking admission for fall 2019. With an incoming class size of 1,545 students, William & Mary has almost 9.5 applicants for every student enrolled. Given its robust applicant pool, the credentials of admitted students remain strong. These statistics, coupled with the university’s academic reputation, suggest a strong continuing student demand into the future. University programs are supported from a variety of sources, including state funds, tuition and fees, auxiliary enterprise revenues (generated by activities that receive no state support such as residence life, food service, athletics, etc…), federal grants and contracts and private funds. This diversity of funding is critical to William & Mary’s overall financial health. The commonwealth provides partial operating support for the university’s academic programs as well as need-based aid for Virginia undergraduates. The level of state support for operations is a function of general economic conditions and the priority assigned to higher education by the governor and General Assembly. After fully absorbing a 5 percent reduction in state funding in FY18, FY19 was a year of level state support for operations and need-based financial aid. While state support was level, other revenue sources remained strong, largely mitigating the lack of incremental state funds. In addition, the 2018-20 Appropriation Act provides significant new state investment in William & Mary for FY20. Over the last year, the university remained committed to tuition predictability for its in-state undergraduate students. Guaranteed four-year tuition for in-state undergraduate students, combined with significant investment in financial aid for qualifying low- and middle-income Virginia families, resulted in William & Mary being one of the most affordable universities in the commonwealth for these students. Tuition predictability will continue to be a William & Mary trademark for students entering in fall 2020. FY19 budgets were developed within the context of the university’s upcoming strategic planning process and existing Board of Visitors-approved Six-Year Plan. As a result, expenditures in support of the university’s academic program included:
Broadly, FY19 expenditures support the university's strategic priorities as well as those of the commonwealth, including expanded aid for low- and middle-income Virginia families while balancing revenue need with student affordability and continuing the university's efforts to raise private funds and seek other revenue sources. In support of these investments, William & Mary continued to identify opportunities for academic and business process improvements, allowing the university to reallocate $1.7 million to higher priority activities. |
||||||||||||||||||||||||||||||||||||||||||||||||||||||||||||||||||||||||||||||||||||||||||||||||||||||||||||||||
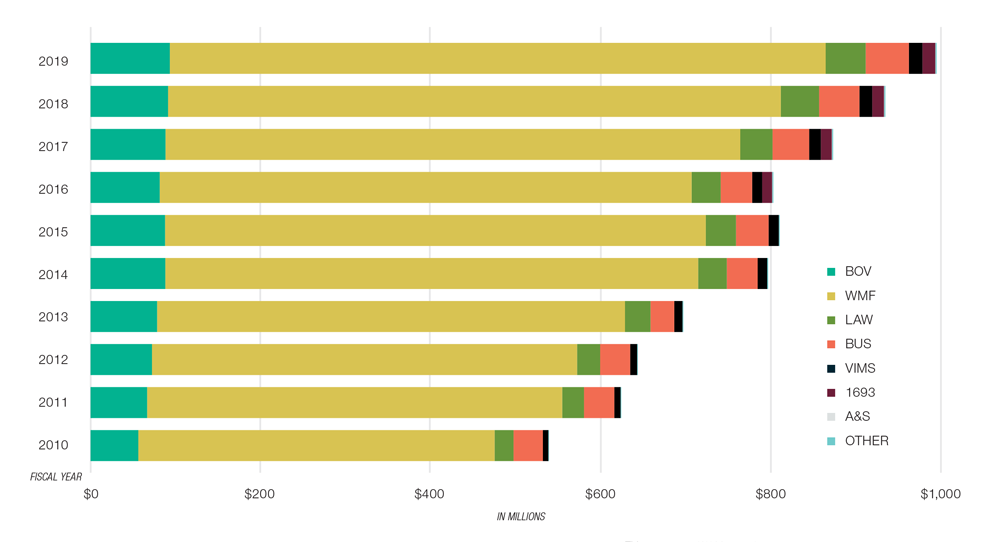
InvestmentsWithin this environment, on June 30, 2019, the consolidated value of endowments held by all of the various entities supporting William & Mary and its programs for the first time exceeded $1 billion, totaling $1.023 billion, including $27.2 million in revocable endowments held by third parties. This is a year-over-year increase of $60.9 million, or 6.3 percent. Of this amount, $715.4 million (70 percent) was invested through the William & Mary Investment Trust (WAMIT), which had an overall investment return of 5.4 percent, exceeding the blended Policy Benchmark return of 3.7 percent. Growth in FY19 reflects investment returns net of fees, new gifts and receivables, market changes in externally managed accounts, changes in property holdings and spending withdrawals. WAMIT’s legal structure is a grantor group trust that allows eligible tax-exempt 501(c)(3) organizations affiliated with the university to pool assets under a collective investment platform. WAMIT remains the largest of the various investment portfolios and is highly diversified across asset classes with a goal of maximizing long-term real return consistent with appropriate risk tolerances and the recognized need to preserve intergenerational equity. William & Mary Investment Trust (WAMIT) Performance ReportAs of June 30, 2019
(1) Investment performance is net of all fees and expenses (2) Policy Benchmark: 56% MSCI All Country World Index, 24% Bloomberg Barclays Aggregate Index, 2% Bloomberg Barclays U.S. Credit Index, 8% Bloomberg Barclays U.S. High Yield Index, 10% Bloomberg Commodity Index, Beginning January 1, 2017: 50% MSCI All Country World Index, 15% Russell 2000 Index, 10% Bloomberg Barclays Aggregate Index, 15% HFR Fund of Funds Index, 5% MSCI U.S. REIT Index, 5% S&P North American Natural Resources Index WAMIT Asset AllocationThis represents the collective investments of the W&M Foundation, Business School Foundation, Law School Foundation, VIMS Foundation and the 1693 Murray Foundation as of June 30, 2019.
*The 100 percent figure is derived from total equities, diversifying strategies, cash, real assets and fixed income. The trade war between the U.S. and China accelerated in FY19. Both sides implemented and then increased tariffs on a combined $360 billion worth of goods. The conflict raised concerns of an acceleration towards a “tech war,” as the U.S. hardened its negotiation position on a key Chinese multinational technology company. Major central banks pivoted to a more dovish stance, inflation expectations plummeted and the aforementioned U.S. China trade war diminished the market’s global growth outlook and the outlook for corporate profitability. During FY19, U.S. equities (as measured by the S&P 500) returned 10.4 percent besting the developed international (MSCI EAFE) and emerging markets (MSCI Emerging Markets), which returned 1.08 and 1.21, respectively.
|
||||||||||||||||||||||||||||||||||||||||||||||||||||||||||||||||||||||||||||||||||||||||||||||||||||||||||||||||
FacilitiesIn addition to operating dollars, investment in our facilities and infrastructure remains strong. Through a combination of state, university and private funds, projects under construction in FY19 included state of-the-art educational and performance facilities for our music, theater and dance programs, an expanded Alumni House, the Tribe Field Hockey Center, and renovations to one of our most popular residence halls, One Tribe Place. Planning continued for an addition to the Sadler Center as well as a fourth phase of the Integrated Science Center, which when complete, will house kinesiology and health sciences, mathematics and computer science as well as provide space for the new engineering and design initiative. |
||||||||||||||||||||||||||||||||||||||||||||||||||||||||||||||||||||||||||||||||||||||||||||||||||||||||||||||||
For the Bold by the NumbersHighlightsSince the beginning of the campaign on July 1, 2011, private support has helped make the following possible:
10-Year Growth in Consolidated Endowment
This represents W&M-owned endowment, excluding revocable amounts. |
||||||||||||||||||||||||||||||||||||||||||||||||||||||||||||||||||||||||||||||||||||||||||||||||||||||||||||||||
Future OutlookOur future reflects the positive results and direction of FY19 as well as ongoing challenges. With competition for admission to William & Mary remaining intense, the university will meet its enrollment targets while admitting the highest quality students. As we look to future revenue streams, in the near term, state support will increase, with targeted allocations for high-demand degrees, including education, data science and computer science. For the longer term, the level of state support will remain uncertain as higher education competes for limited state funds in a challenging economic environment. Virginia’s economy, and its tax revenue, remains dependent to a large extent on federal government and military spending. So long as Washington, D.C., remains unsettled, consistent and stable funding from the commonwealth may be challenged. As Virginia moves to more diverse and less federally dependent funding, revenue may stabilize. Pending this transition, the university will continue to exercise caution in making commitments that assume state support. Tuition and fees revenue will continue to increase but at a decreasing rate as tuition levels approach market rates. These revenues, when combined with increased philanthropy, targeted state funds, reallocations from within the university, and funds generated from new or expanded programs and activities, will allow the university to move forward in implementing initiatives identified through strategic planning. Ongoing investment in University Advancement is producing a great return on investment as the campaign is allowing William & Mary to reach historic levels in fundraising — which is vital as philanthropy now exceeds state funding as part of our total operating budget. Funding generated through annual giving, including giving to the Fund for William & Mary, and endowment growth will provide long-term support for students, faculty and programs and ensure the margin of excellence that distinguishes William & Mary. Unrestricted annual giving is particularly critical, allowing immediate progress in strategic areas. Finally, investment in academic, auxiliary and athletics facilities will provide the physical foundation for academic and athletics success, as well as student growth and development. Completion of the Integrated Science Center will enhance STEM and engineering/design opportunities. An expanded Arts Quarter will mark important progress for our campus revitalization efforts. Just as the Shenkman Jewish Center, McLeod Tyler Wellness Center and the Entrepreneurship Hub at Tribe Square address the needs and interests of our student body, future facility investments will support initiatives coming out of the university’s strategic plan, the athletics strategic plan and other planning efforts. |
||||||||||||||||||||||||||||||||||||||||||||||||||||||||||||||||||||||||||||||||||||||||||||||||||||||||||||||||
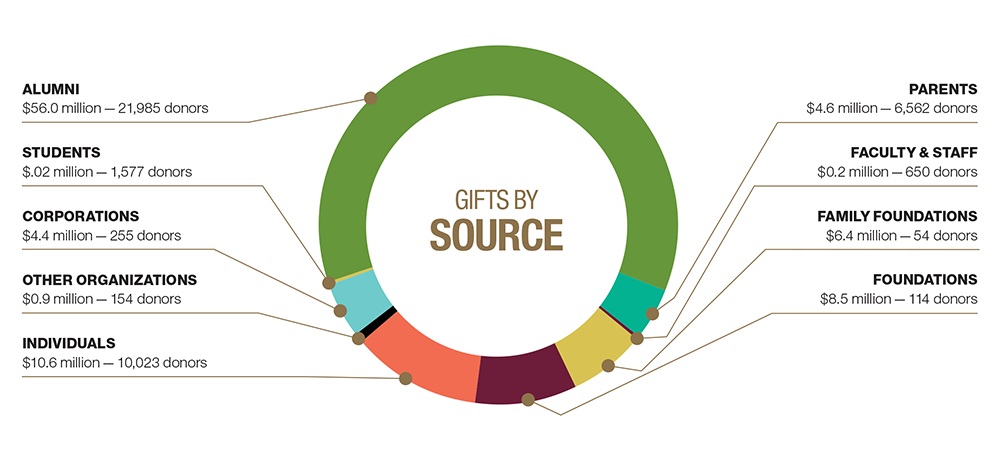
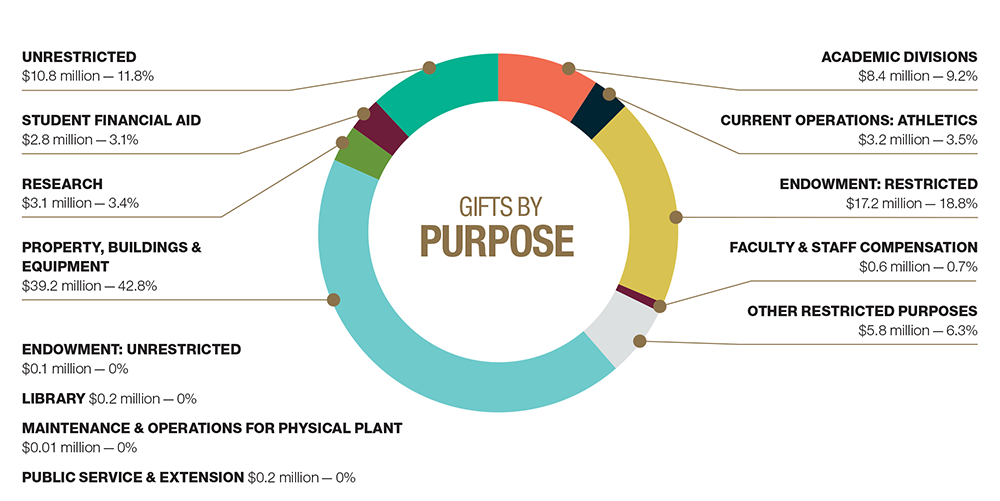
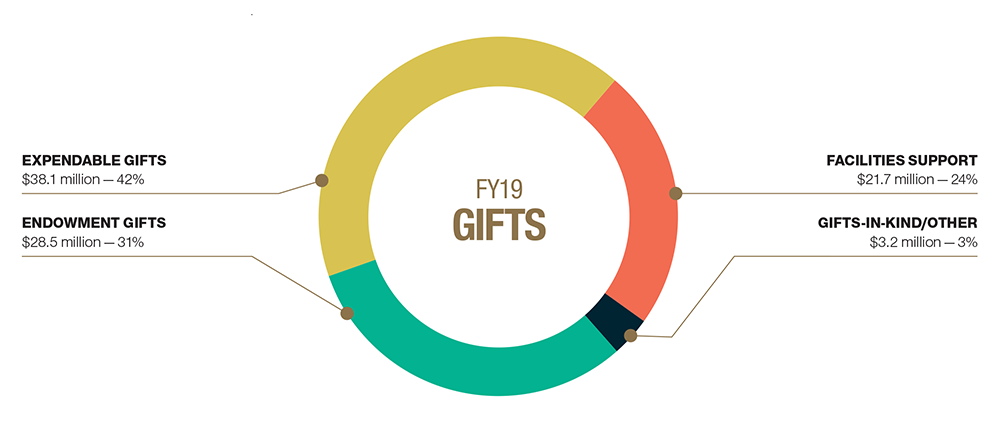
Private GiftsIn FY19, William & Mary raised nearly $92 million in support of the For the Bold campaign. Pledges and commitments, including bequests and deferred gifts, are not indicated in the numbers below. Gifts by AreaThe following chart shows the allocation of gifts made to all areas of William & Mary and its related foundations between July 1, 2018 and June 30, 2019.
Gifts by Source, Purpose and for FY19These graphs show the sources of the nearly $92 million raised in gifts for William & Mary and its related foundations between July 1, 2018 and June 30, 2019.
|
||||||||||||||||||||||||||||||||||||||||||||||||||||||||||||||||||||||||||||||||||||||||||||||||||||||||||||||||
Operating Revenue & Expenses
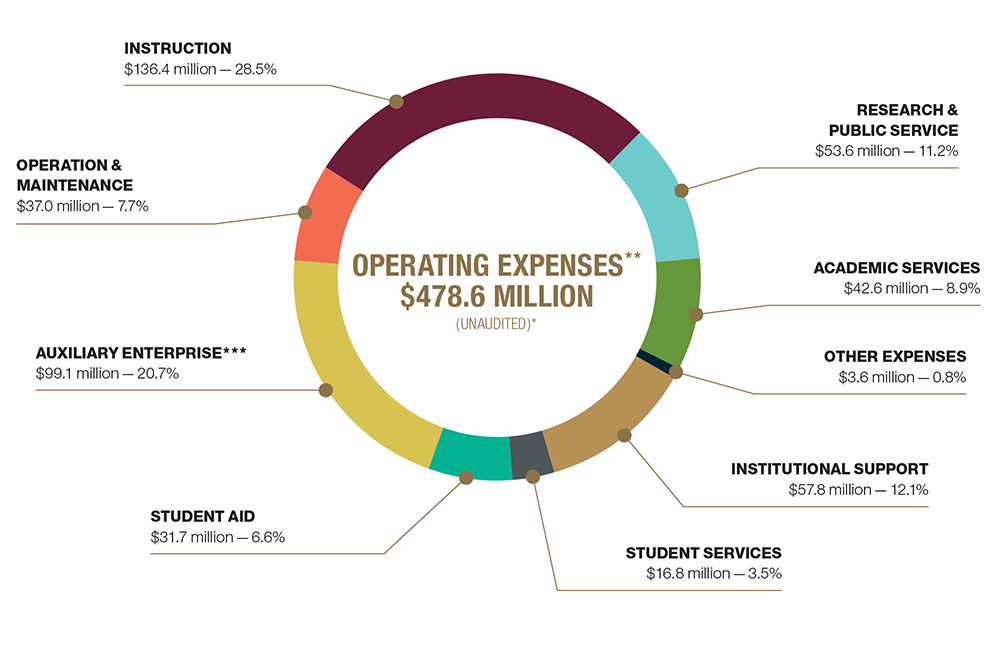
How is W&M's operating revenue spent?Operating expenses, shown below, are divided among the following categories: Instruction: Instructional faculty, departmental operating costs
|
||||||||||||||||||||||||||||||||||||||||||||||||||||||||||||||||||||||||||||||||||||||||||||||||||||||||||||||||
Download the 2019 Financial Report (pdf) to view the full message from Samuel E. Jones ’75, M.B.A. ’80, Senior Vice President for Finance & Administration.


