Mapping Need for NetworkPeninsula
Over the summer, I interned for NetworkPeninsula, a capacity building nonprofit with more than 100 member nonprofits located throughout the Virginia Peninsula region. NetworkPeninsula organizes opportunities for continuing education, training, and workshops for their members to strengthen their organizations to effectively fulfill their missions.
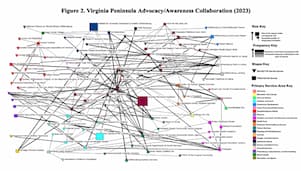
 This project began as a report created by Malcolm Baytop, Ruth Bekele, and Aarushi Desai (MPP Class of 2024) during their Policy Research Seminar in the Fall 2023 semester. They used social network analysis (SNA) to understand nonprofit collaboration across the Virginia Peninsula using survey data. These surveys asked respondents about their interactions with other nonprofits through referral of services, advocacy, and partnerships in services. With its roots in sociology and graph theory, SNA explores the patterns of relationships that exist in social structures. An organization or individual is a ‘node’ and the relationship between nodes is a ‘tie’. In this study, each nonprofit was a node, with their various relationships to other nonprofits (referring services, advocacy, or partnership) defined by a tie.
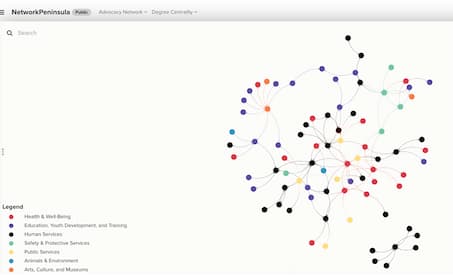
 My assignment with NetworkPeninsula was to make a clearer, more accessible network visualization for a broader audience. I began by cleaning up the data and condensing the primary service area categories (i.e., Human Services, Community Development, Hunger and Food Access) from more than twenty down to seven to make a simpler visual. Additionally, I excluded nonprofits who only act in a funding capacity, as to highlight the organizations offering assistance to the community.
As I worked with the data, I found it difficult to show where the nonprofits provide services across the Peninsula. Many nonprofits serve more than one city or county and have more than one office location, so I decided that a geographic map would be more intuitive to display the locations as a supplement to the network map. Marley Fishburn (MPP ‘25) was working a summer internship at the William and Mary Center for Geospatial Analysis (CGA) and she introduced me to the fellows at CGA, who graciously taught me how to make a map using ArcGIS.
Shannon White, Associate Director of the CGA, describes the utility of ArcGIS across disciplines, “Geographic Information Systems (GIS) software allows people and organizations to examine the “why's of where”. Sometimes, the need it meets is simply making a reference map for an organization or agency. Though the power of GIS is the more complex analysis that can be an output of GIS. Spatial data brought into maps and shared through web apps. Analysis can be performed between layers of data to better answer questions about location-based problems. Examples such as where should a new park in James City County be located to serve a specific population demographic or more complex modeling such as prediction of how x-feet sea-level rise may inundate and impact neighborhoods and the people living in them in the City of Norfolk, VA.”
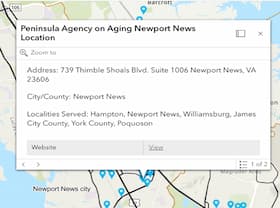
 Using ArcGIS, I mapped over 100 NetworkPeninsula member locations, identifying the office address, localities served, and links to the organizations’ websites.
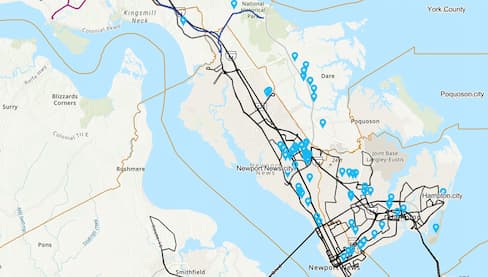
Throughout my internship, I visited member nonprofits with NetworkPeninsula’s Executive Director, Cyndie Callaway, to learn more about the services they provide and the collaboration they have with NetworkPeninsula and other nonprofits. I went to the York-Poquoson Department of Social Services, an office building on Goodwin Neck Road, a few minutes off of George Washington Highway in Yorktown. Surrounded by dense woods, I wondered how easily accessible the building was for those who use public transportation. In my discussion with Margaret Mack-Yaroch, Director of York-Poquoson Social Services, I learned that transportation is a large issue for residents of York County and Poquoson, mainly because there are no bus lines or public transportation options in this area. This gave me the idea to add bus routes to the map of nonprofit locations, not only to be used as a tool for nonprofit clients, but to show the gap in transportation accessibility that exists on the Peninsula.
 As pictured above, there are a number of nonprofits situated right off of George Washington Memorial Highway in York County, but it is clear that there are no buses that make stops in that area. Highlighting where nonprofits are located in relation to bus lines is a useful tool for those who utilize nonprofit services and public transportation and provides an opportunity for policymakers to address the lack of basic services like public transportation. I believe that this work can initiate a bigger conversation about the values that county governments are communicating in their public policies, hopefully shining a light on people and issues that historically go overlooked and ignored.
Link to StoryMap with SNA network visualization and geographic map


