


Compared to Jan/Feb 2020, how has your workload (pace, volume, etc.) changed?
Date:
March 9, 2021
Audience:
Staff
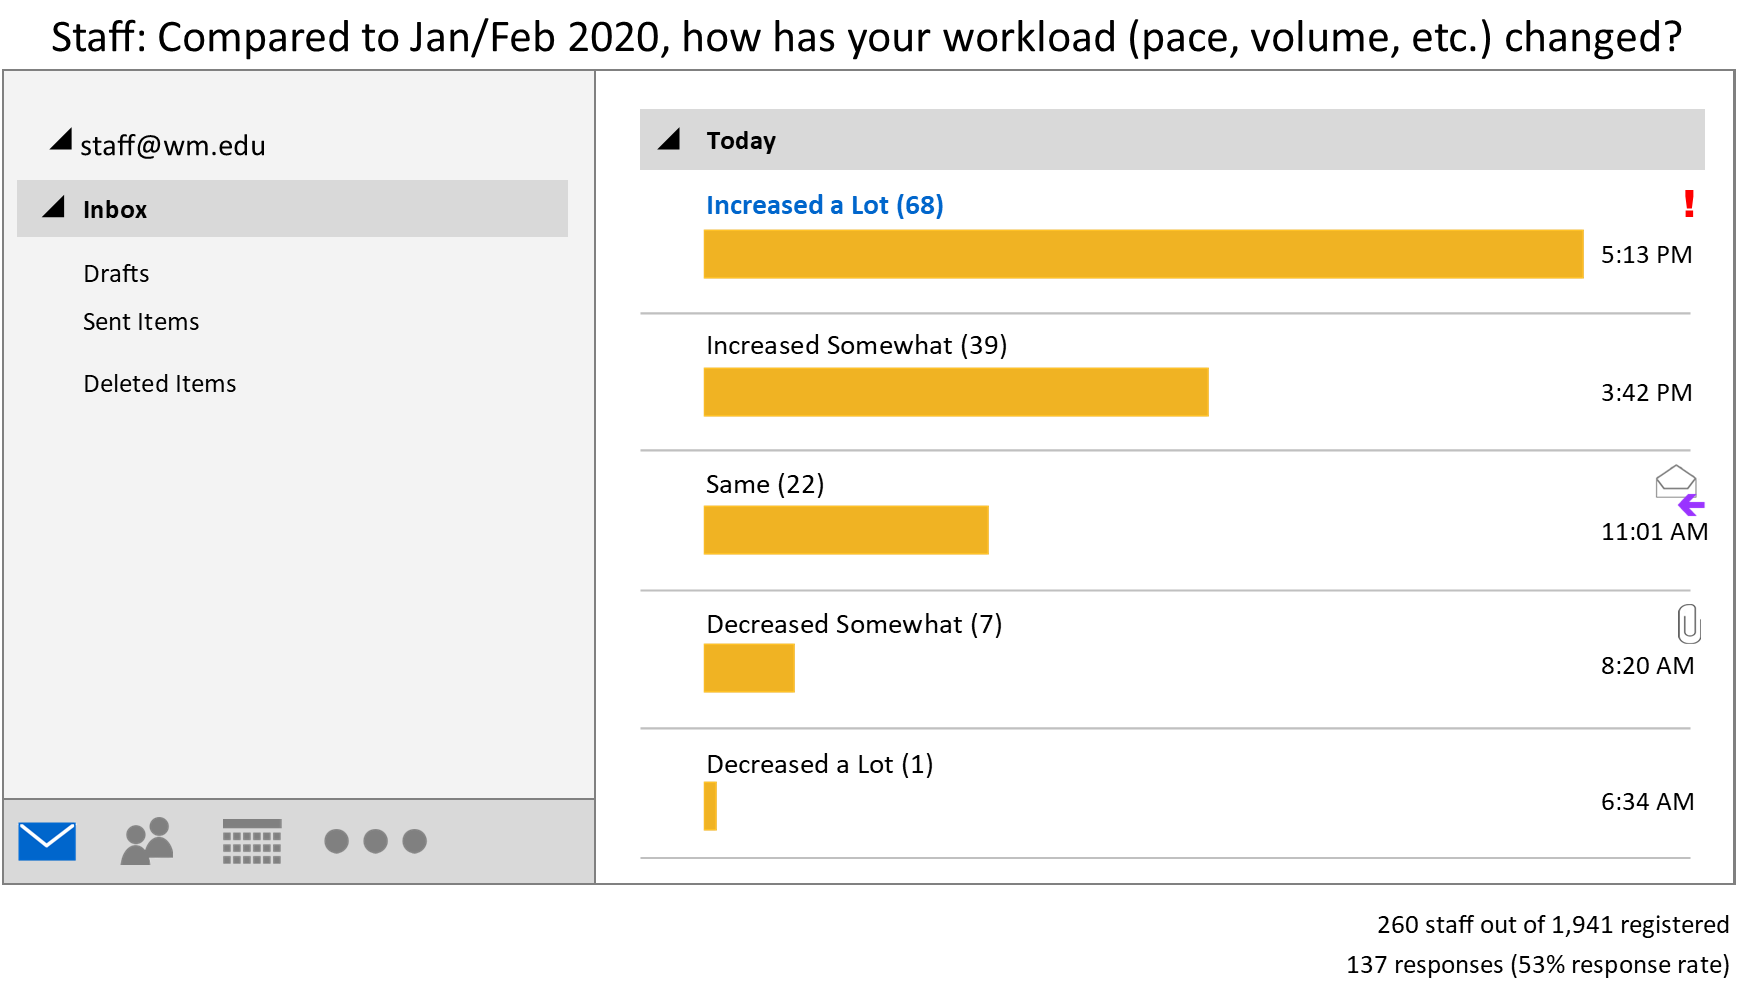
On March 9, 2021, we asked 260 registered staff users (out of a total population of 1,941):
Compared to Jan/Feb 2020, how has your workload (pace, volume, etc.) changed?
Increased a lot
Increased somewhat
Same
Decreased somewhat
Decreased a lot
Why?
We received 137 responses (53% response rate) to the scaled workload question:
- Increased a lot: 49.6%
- Increased somewhat: 28.5%
- Same: 16.1%
- Decreased somewhat: 5.1%
- Decreased a lot: 0.7%
We received 74 responses yielding 97 data points (28% response rate) explaining the scaled response selected, which we analyzed and consolidated into 14 categories:
- Increased due to nature of work/workflow patterns: 15.8%
- Increased due to staffing factors: 15.8%
- Increased due to COVID-specific demands or restrictions: 13.7%
- Increased due to pace/volume/expectations for work: 11.6%
- Increased due to new initiatives/changes in duties/changes in processes: 11.6%
- Same due to nature of work/workflow patterns: 6.3%
- Increased due to increased student participation/activities/programming: 5.3%
- Increased due to work processes/tasks being more labor intensive: 4.2%
- Increased due to last minute planning/short turnaround time for projects: 3.2%
- Increased due to new role/responsibilities: 3.2%
- Same due to other factors: 3.2%
- Decreased due to COVID-specific restrictions: 2.1%
- Decreased due to improved processes/greater efficiency: 2.1%
- Decreased due to nature of work/workflow patterns: 2.1%
