


Compared to pre-COVID, how much time do you now spend on service in a typical week?
Date:
March 2, 2021
Audience:
Faculty
On March 2, 2021, we asked 139 registered faculty users (out of a total population of 870):
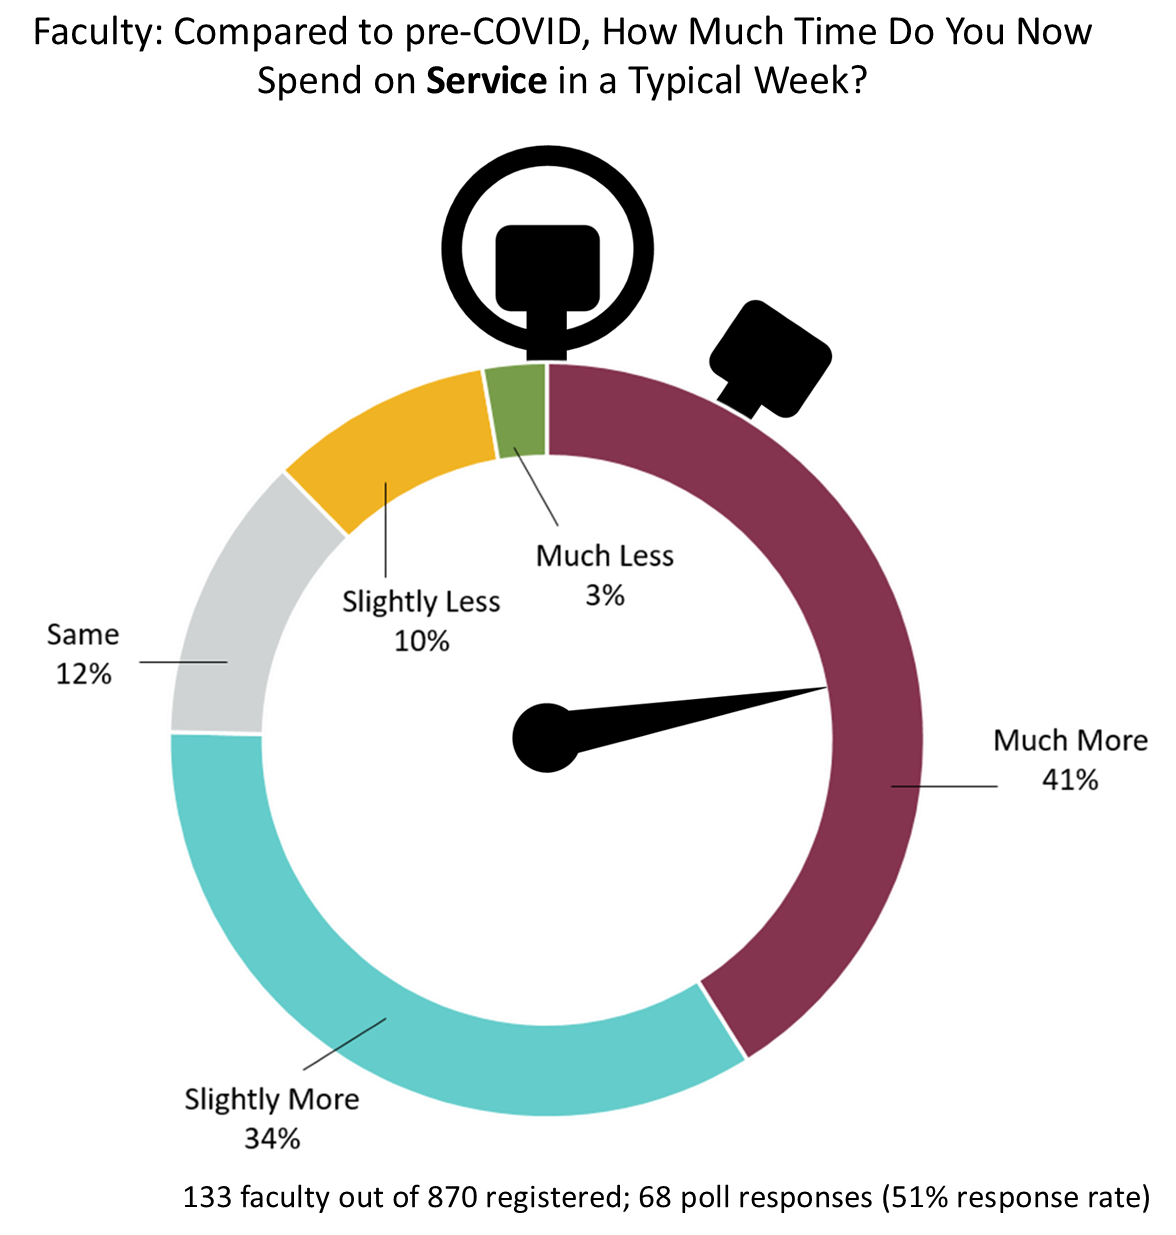
Compared to pre-COVID, how much time do you now spend on service in a typical week?
A) Much more
B) Slightly more
C) Same
D) Slightly less
E) Much less
Explain
We received 73 responses to the scaled question (53% response rate):
- Much more: 41.1%
- Slightly more: 34.2%
- Same: 12.3%
- Slightly less: 9.6%
- Much less: 2.7%
We received 13 responses yielding 17 data points (9% response rate) explaining the scaled response selected, which we analyzed and consolidated into six categories:
- More because advising/mentoring students takes more time: 23.5%
- More because of new demands on existing committees/new committees: 17.6%
- More because regular service work is more time consuming: 17.6%
- More (other/unspecified): 17.6%
- More because of work managing W&M COVID response: 11.8%
- Less (other/unspecified): 11.8%
