


Compared to pre-COVID, how much time do you now spend on teaching in a typical week? Compared to pre-COVID, how much time do you now spend on research in a typical week?
Date:
February 23, 2021
Audience:
Faculty
On February 23, 2021, we asked 133 registered faculty users (out of a total population of 870):
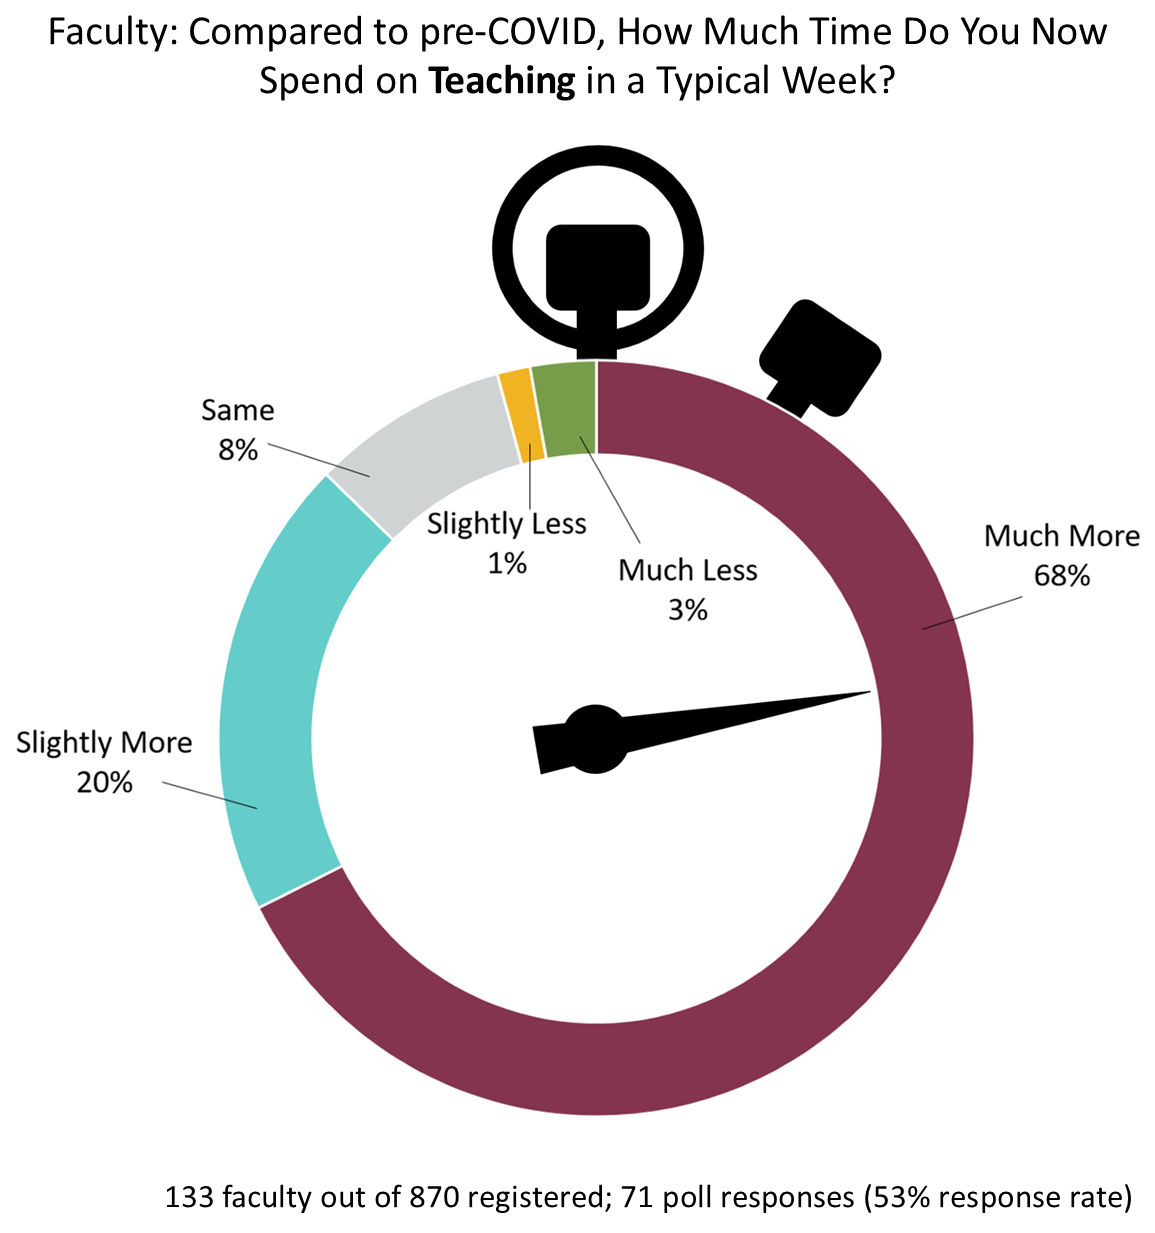
Compared to pre-COVID, how much time do you now spend on teaching in a typical week?
A Much more
B Slightly more
C Same
D Slightly less
E Much less
Explain
and
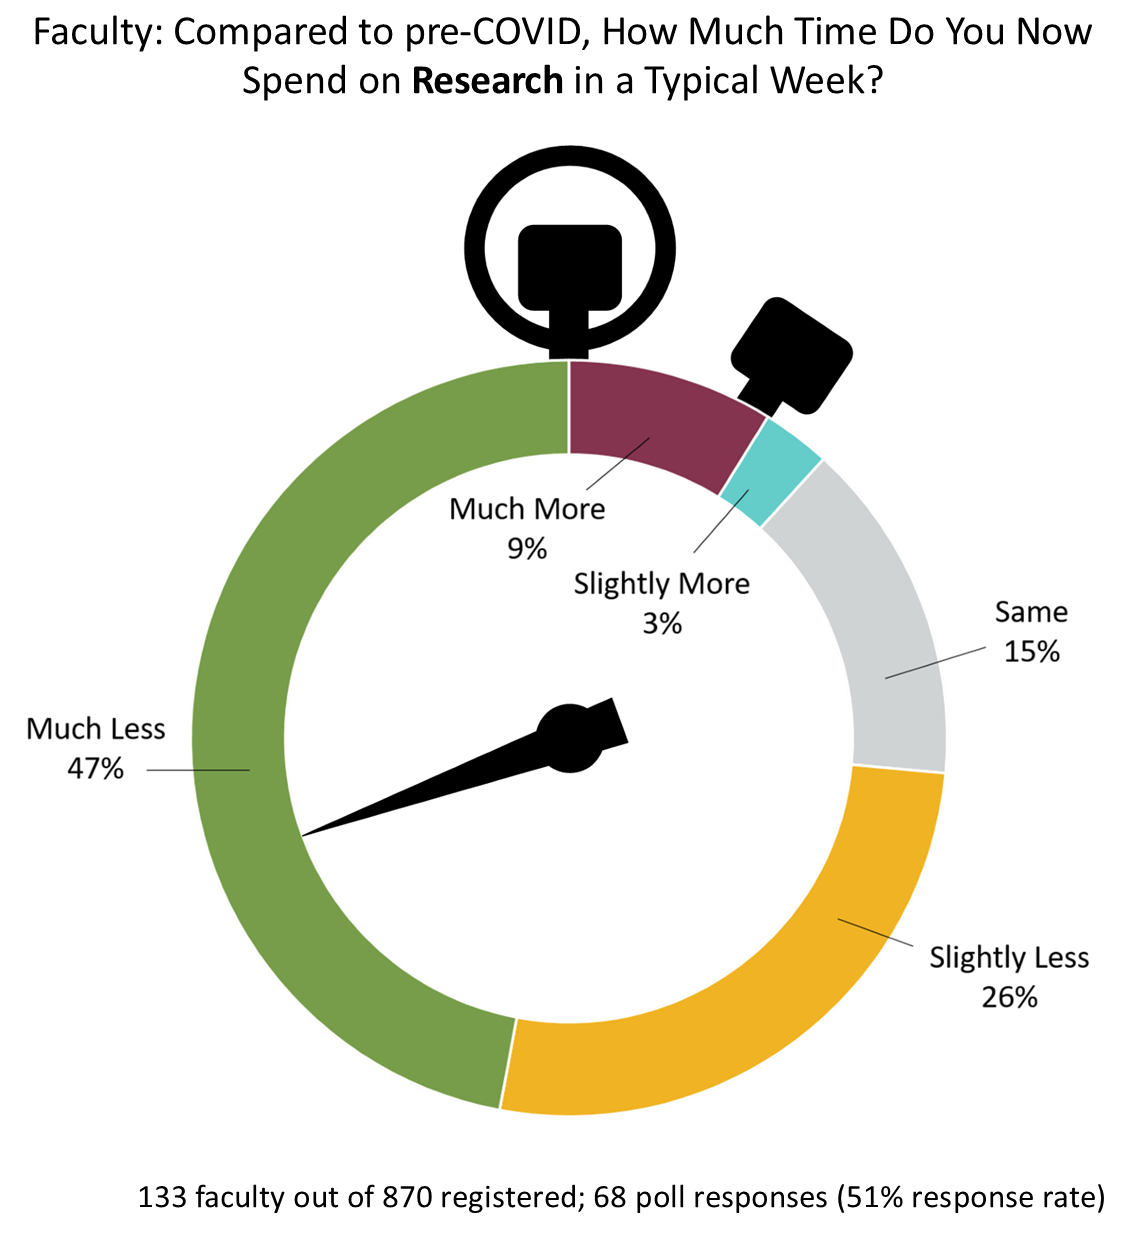
Compared to pre-COVID, how much time do you now spend on research in a typical week?
1 Much more
2 Slightly more
3 Same
4 Slightly less
5 Much less
Explain
We received 71 responses to the scaled teaching question (53% response rate):
- Much more: 67.6%
- Slightly more: 19.7%
- Same: 8.5%
- Slightly less: 1.4%
- Much less: 2.8%
We received 68 responses to the scaled research question (51% response rate):
- Much more: 8.8%
- Slightly more: 2.9%
- Same: 14.7%
- Slightly less: 26.5%
- Much less: 47.1%
We received 27 responses yielding 42 data points (20% response rate) explaining the scaled teaching response selected, which we analyzed and consolidated into four categories:
- More Due to Time Spent Converting Courses/Learning Technology: 47.6%
- More Due to Students Needing Additional Support/Communication/Engagement: 40.5%
- More Due to Other Individual Circumstances: 7.1%
- Less Due to Other Factors: 4.8%
We received 25 responses yielding 36 data points (19% response rate) explaining the scaled research response selected, which we analyzed and consolidated into nine categories:
- Less due to Time spent on teaching/preparation for teaching: 36.1%
- Less due to Time spent on service/administrative work: 11.1%
- No research component to position: 8.3%
- Less due to Personal Circumstances/Obligations: 8.3%
- Less due to Responding to greater student needs: 8.3%
- Less Due to Other Factors: 8.3%
- More Due to Other Factors: 8.3%
- Same Amount of Time: 5.6%
- Less due to loss of funding/access to resources: 5.6%
